
Most enterprises can see their cloud bill. Far fewer can say whether that spend is creating business value.
Finance sees monthly invoices. Engineering sees utilization. Leadership needs one view that connects both — and that view is built on FinOps KPIs.
This guide covers the 12 FinOps KPIs that mature programs track, with the formula and the owner for each. It also explains why traditional cost reporting falls short, how KPIs shift across the FinOps lifecycle, and how to move from measuring cloud costs to acting on them.
What are FinOps KPIs?
FinOps KPIs are standardized measurements that connect cloud spending to business outcomes. They show who owns each cost, how efficiently resources support products and customers, how predictable spend is, and how much value optimization actually delivers — turning the cloud bill into a business performance indicator.
FinOps KPIs vs. FinOps metrics
The two terms are often used interchangeably, but the distinction is useful:
- FinOps metrics are any measurement of cloud cost or usage: total spend, cost per service, idle instance count.
- FinOps KPIs are the small set of metrics tied to a goal, with a target and an owner: allocation coverage above a threshold, unit cost trending down as revenue grows.
Every KPI is a metric. Only a few metrics deserve to be KPIs.
The right KPIs help answer questions such as:
- Which teams are driving cloud cost growth?
- Are cloud costs growing faster than revenue?
- Which products run most efficiently?
- How accurately can next quarter’s spend be forecast?
- How much identified savings actually gets executed?
The 12 FinOps KPIs at a glance
The table below lists each KPI, how to calculate it, who owns it, and the FinOps phase where it matters most.
| KPI | Formula | Owner | FinOps phase |
|---|---|---|---|
| Cost allocation coverage | Allocated spend ÷ total cloud spend × 100 | FinOps lead | Inform |
| Tagging compliance | Correctly tagged resources ÷ total taggable resources × 100 | Platform engineering | Inform |
| Unit cost | Cloud cost of a product or service ÷ business units (customers, transactions, API calls) | Product + Engineering | Optimize |
| Cloud cost as % of revenue | Total cloud spend ÷ revenue × 100 | Finance (CFO) | Operate |
| Waste rate | Spend on idle, unused or orphaned resources ÷ total cloud spend × 100 | Engineering | Optimize |
| Resource utilization | Consumed capacity ÷ provisioned capacity × 100 | Engineering | Optimize |
| Commitment coverage | Spend covered by Savings Plans or Reserved Instances ÷ commitment-eligible spend × 100 | FinOps lead | Optimize |
| Commitment utilization | Commitment used ÷ commitment purchased × 100 | FinOps lead | Optimize |
| Effective savings rate (ESR) | (On-demand equivalent cost − actual cost) ÷ on-demand equivalent cost × 100 | FinOps lead | Optimize |
| Forecast accuracy | 1 − (|forecasted spend − actual spend| ÷ forecasted spend) | Finance + FinOps | Operate |
| Budget variance | (Actual spend − budgeted spend) ÷ budgeted spend × 100 | Finance | Operate |
| Savings realization rate | Savings executed ÷ savings identified × 100 | FinOps lead + Engineering | Operate |
Tracking these by hand across AWS, Azure and Google Cloud rarely scales. Pier’s Lighthouse lets teams track FinOps KPIs and unit economics in one place, with cost allocated to the teams and products that own it.
Why traditional cloud cost metrics fall short
Most organizations already report on total cloud spend, month-over-month variance, budget utilization and cost per service. These reports show what happened. They rarely explain why, or what to do next.
Knowing that AWS spend rose 18% doesn’t tell you:
- Whether the increase supported business growth
- Which engineering teams generated it
- Whether new workloads improved customer value
- Whether efficiency improved or declined
Without that context, Finance tends to respond with reactive cost cuts that slow engineering down.
FinOps KPIs change the question from “How much did we spend?” to “What value did that spend create — and what are we doing about the rest?”
The core FinOps KPIs, explained
The 12 KPIs fall into six groups. Each group answers a different question — and most programs should master them roughly in this order.
1. Allocation KPIs: cost allocation coverage and tagging compliance
Cost allocation coverage measures how much of total cloud spend can be attributed to a team, business unit, product, application, customer or cost center. Tagging compliance measures how much of the infrastructure carries the tags that make that attribution possible.
High-performing FinOps teams raise allocation coverage before launching optimization, because optimization only sticks when ownership is clear. Allocation also enables showback and chargeback, product profitability analysis, budgeting and unit economics.
You can’t optimize what you can’t attribute.
2. Unit economics KPIs: unit cost and cloud cost as % of revenue
Unit cost connects cloud spend to business activity: cost per customer, per transaction, per API request, per tenant or per deployment. Cloud cost as a percentage of revenue shows the same relationship at company level.
For engineering leaders, unit cost exposes architectural efficiency. For Finance, it creates a shared language that links cloud spend to gross margin. The signal to watch is direction: healthy growth means unit cost falls, or holds, as volume rises.
Unit economics is one of the clearest markers of a mature program — see the FinOps maturity model for how it evolves across stages.
3. Efficiency KPIs: waste rate and resource utilization
Not every cloud dollar creates value. Waste rate captures spend on resources that deliver nothing: idle virtual machines, orphaned storage volumes, unused snapshots, overprovisioned databases, low-utilization Kubernetes clusters. Resource utilization shows how much provisioned capacity is actually consumed.
Mature teams read these alongside performance and availability. The goal is sustainable efficiency, not indiscriminate cuts.
4. Rate optimization KPIs: commitment coverage, commitment utilization and ESR
Usage KPIs tell you how much you consume. Rate KPIs tell you how well you pay for it.
- Commitment coverage shows how much eligible spend runs on Savings Plans or Reserved Instances instead of on-demand pricing.
- Commitment utilization shows how much of what you committed to is actually used. Low utilization means you are paying for discounts you don’t consume.
- Effective savings rate (ESR) combines both into one number: the real discount you achieve versus paying full on-demand prices.
ESR is the most useful single KPI for rate optimization because high coverage with poor utilization, or the reverse, both drag it down.
5. Predictability KPIs: forecast accuracy and budget variance
Forecast accuracy measures how closely projected spend matches actual consumption. Budget variance measures the gap between actual spend and the approved budget.
Cloud costs move with product adoption, releases, customer growth and migrations, so forecasting well is hard — and valuable. Accurate forecasts reduce budget surprises and give executives confidence to invest.
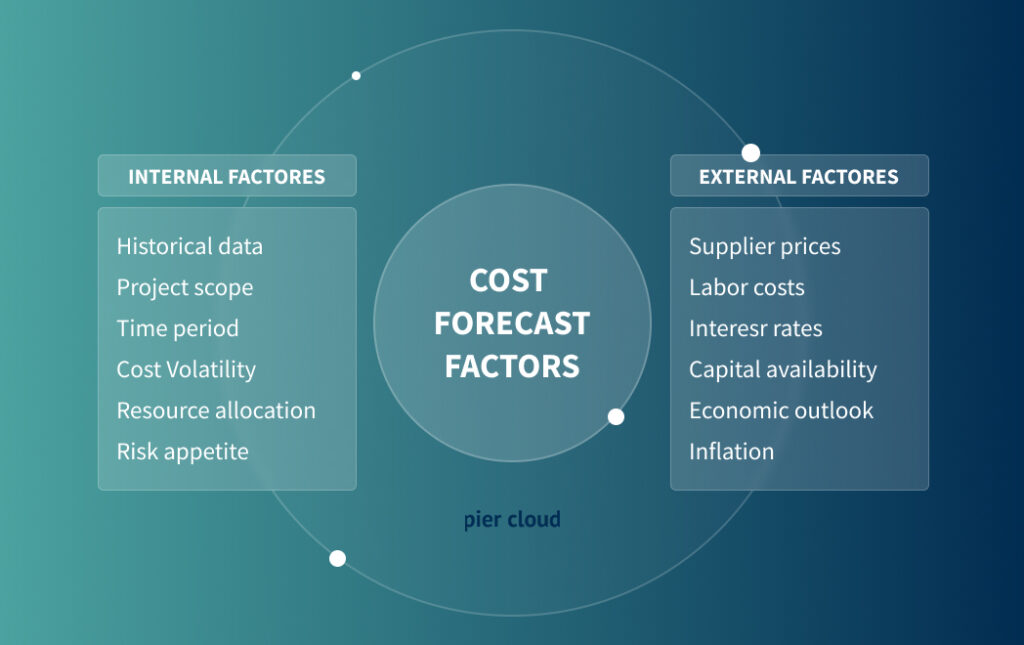
How to improve forecast accuracy
- Combine history with business context. Past usage is a baseline, not a prediction. Add roadmap milestones, customer acquisition projections, planned migrations and seasonality.
- Standardize and automate the data. Inconsistent tagging and spreadsheet processes compound errors. Enforce tagging policies, centralize allocation rules and automate anomaly detection.
- Model several scenarios. Build baseline, high-growth, conservative and risk scenarios instead of a single number.
- Add operational signals. Deployment schedules, Kubernetes cluster growth, API request volume and onboarding projections predict spend earlier than invoices do.
- Measure the forecast itself. Compare forecast to actual every cycle, identify the cause of each variance and refine the model.
6. Value KPIs: savings realization rate and time to action
This is where most FinOps programs quietly fail. Dashboards identify savings; far fewer organizations execute them.
Savings realization rate measures the share of identified savings that is actually captured. Two practical companions:
- Time to action: how long it takes from a recommendation or anomaly to the change in production.
- Engineering hours spent on FinOps tasks: the manual effort each dollar of savings costs.
A low realization rate is not a visibility problem — it’s an execution problem. It’s the gap agentic FinOps is designed to close: agents such as Pier’s LIA act on optimization opportunities within defined guardrails instead of adding them to a backlog.
The goal isn’t to spend less. It’s to get more value from every cloud dollar.
FinOps KPIs across the FinOps lifecycle
The KPIs a team prioritizes shift as its practice matures. Each phase of the FinOps lifecycle calls for a different set.
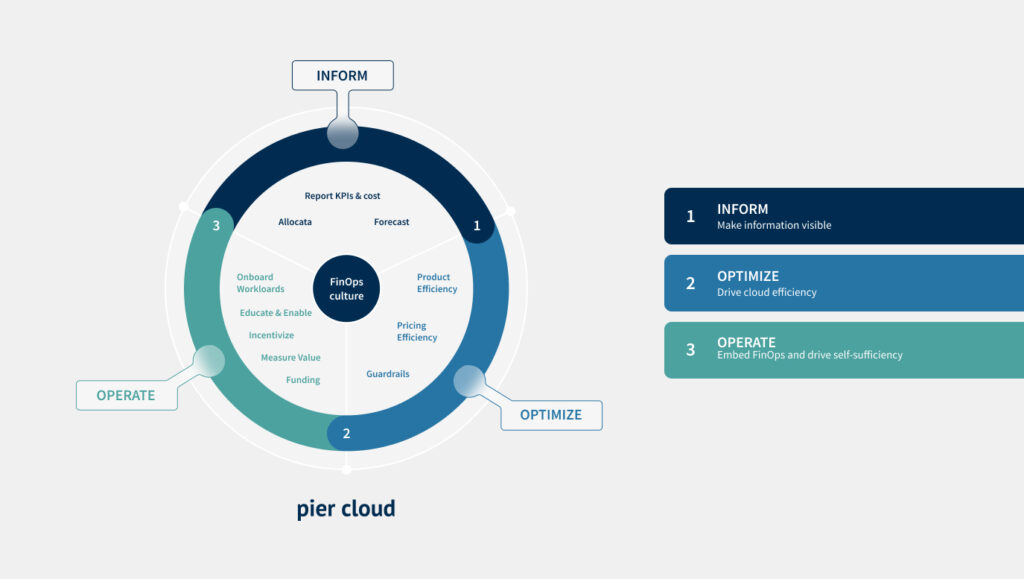
| Phase | Goal | Priority KPIs |
|---|---|---|
| Inform | Visibility and accountability | Cost allocation coverage, tagging compliance |
| Optimize | Efficiency without slowing engineering | Unit cost, waste rate, resource utilization, commitment coverage and utilization, ESR |
| Operate | Governance and predictability | Forecast accuracy, budget variance, cloud cost as % of revenue, savings realization rate |
Without reliable visibility in Inform, optimization is speculative. By Operate, FinOps stops being a series of projects and becomes a continuous operating capability — increasingly one where AI agents handle the repeatable actions and people handle the judgment calls.
Who uses FinOps KPIs?
In a mature practice, cloud financial data isn’t confined to one team. Each stakeholder works toward the same goal but needs a different slice.
| Stakeholder | What they need to know | KPIs they rely on |
|---|---|---|
| Engineering | Is the architecture efficient without slowing delivery? | Resource utilization, unit cost, waste rate, commitment utilization |
| Finance | Is spend predictable and accountable? | Forecast accuracy, budget variance, allocation coverage, cloud cost as COGS |
| FinOps team | Are we paying the right rate and capturing savings? | ESR, commitment coverage, savings realization rate |
| Executive leadership | Is cloud investment improving profitability as we scale? | Cloud cost as % of revenue, unit cost trend, savings realization rate |
For engineering, FinOps KPIs become an input to architecture decisions rather than a financial control. For Finance, they replace monthly invoice reviews with a seat in strategic planning. For executives, they become a decision framework for balancing growth and margin.
Building a FinOps KPI framework that scales
Choosing KPIs is the first step. Keeping them accurate, consistent and actionable as the environment grows is the harder one.
An effective FinOps KPI framework should:
- Define a standard set of business KPIs across departments
- Assign a clear owner to every KPI and every cost
- Automate data collection wherever possible
- Continuously validate allocation accuracy
- Review KPIs as business priorities change
The most successful organizations don’t track dozens of disconnected metrics. They track a concise set — usually the 12 above, or fewer — that ties directly to business objectives. Platforms like Pier’s Lighthouse bring allocation, unit economics and KPI tracking into a single source of truth, so Finance, Engineering and Product argue about decisions instead of numbers.
From measuring to acting
Visibility is where a FinOps journey starts, but visibility alone creates no value. A dashboard shows where money goes. It doesn’t explain why costs rose, whether spend tracks growth, or — most importantly — make the change.
That’s the limit of the recommendation-only model: insights pile up faster than teams can act on them, and the savings realization rate stalls.
The next stage of FinOps closes that loop. KPIs define what good looks like; AI agents execute the optimizations that move them, within the guardrails the organization sets. Measurement stops being the end of the process and becomes its control system.
FAQ: FinOps KPIs
What are the most important FinOps KPIs?
The most widely used FinOps KPIs are cost allocation coverage, unit cost, waste rate, effective savings rate, commitment coverage, forecast accuracy and budget variance. Mature programs add savings realization rate to measure how much identified savings is actually executed.
What is the difference between FinOps KPIs and FinOps metrics?
A FinOps metric is any measurement of cloud cost or usage. A FinOps KPI is a metric tied to a business goal, with a target and an accountable owner. Every KPI is a metric, but only a small set of metrics should be treated as KPIs.
How do you calculate forecast accuracy in FinOps?
A common formula is forecast accuracy = 1 − (|forecasted spend − actual spend| ÷ forecasted spend). A result of 0.95 means actual spend landed within 5% of the forecast. Track it over several cycles to see whether your forecasting model is improving.
What is effective savings rate (ESR)?
Effective savings rate is the real discount an organization achieves on cloud compute versus paying on-demand prices. It is calculated as (on-demand equivalent cost − actual cost) ÷ on-demand equivalent cost. It reflects both how much spend is covered by commitments and how well those commitments are used.
What is a unit cost in FinOps?
Unit cost is cloud spend divided by a business unit such as customers, transactions, API calls or tenants. It shows whether cloud costs scale efficiently with the business. Falling or stable unit cost during growth is a sign of a healthy architecture.
Who owns FinOps KPIs?
Ownership is shared. FinOps teams typically own allocation and rate KPIs, Engineering owns utilization and waste, Finance owns forecast accuracy and budget variance, and executives track cloud cost as a percentage of revenue and unit cost trends.
How many FinOps KPIs should a company track?
Most organizations do best with 8 to 12 KPIs, prioritized by FinOps maturity. Early programs focus on allocation coverage and tagging compliance; mature programs add unit economics, ESR, forecast accuracy and savings realization rate.
Final thoughts
Tracking cloud spend is no longer enough. Enterprises need KPIs that connect infrastructure investment to business outcomes — and a way to act on what those KPIs reveal.
The right FinOps KPIs establish accountability, align Finance and Engineering, make forecasts credible and show whether optimization is creating value. The organizations that pull ahead will be the ones that close the gap between knowing and doing.
FinOps KPIs are not just reporting. They are the control system for every cloud dollar you invest.
See your FinOps KPIs and unit economics in Lighthouse — and let LIA act on them. Get a demo.